If you are planning to install solar panels, one of the first questions is how much electricity will they actually produce over the year?
Honestly, I installed my panels without such research. I simply directed them south and installed them vertically - at an angle of 90°. One of the reasons for this decision was to minimize snow accumulation in winter so they could work better at low sun positions.
After a few months of operation, I became curious: how much will generation drop in winter?
I have 3.84 kW of solar panels installed, and even a small generation in winter would be useful. For example, to partially power the boiler, pumps, and a couple of light bulbs.
Of course, each installation is unique. Generation is influenced by orientation, tilt angle, installation location, weather, and many other factors.
Therefore, I wanted to not just guess, but try to estimate this more technically.
For this, I used the Global Solar Atlas - a service that allows you to model the expected generation of a solar power plant considering its capacity, orientation, and tilt angle. This is not an advertisement. This service can be quickly found on Google, seems to have no ads, and is supported by several companies.
It allows you to specify the installation location, capacity of the solar station, orientation, and tilt angle of the panels and get an approximate generation forecast.
In this article, I will show this using my own example.
Opening Global Solar Atlas
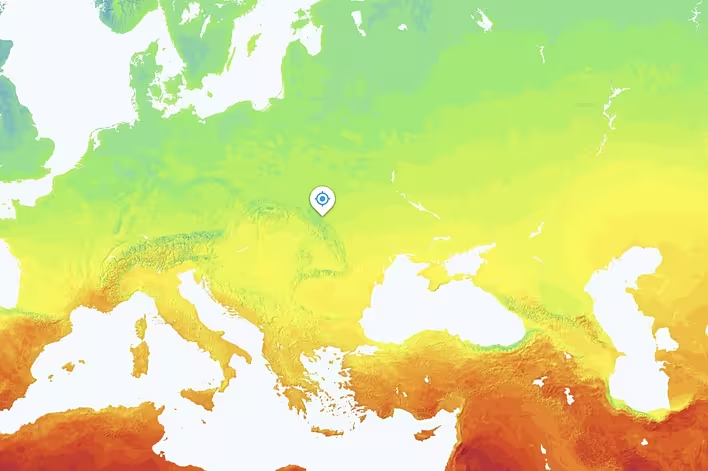
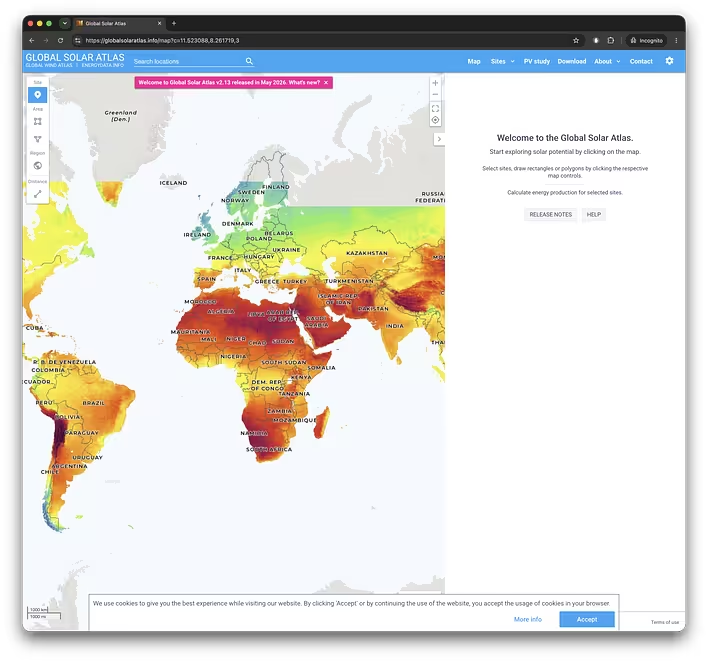
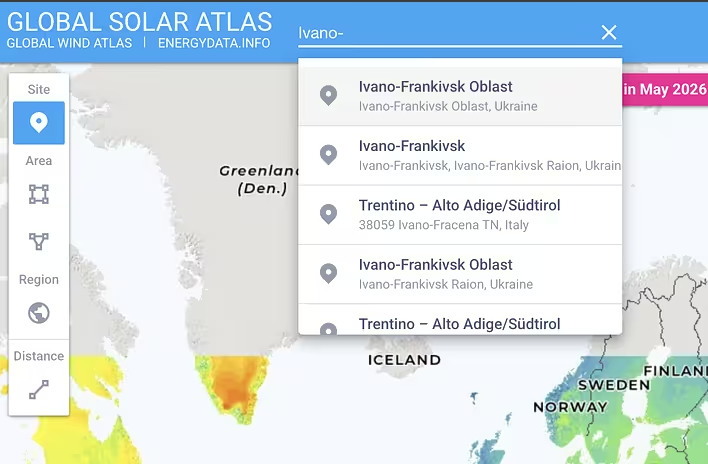
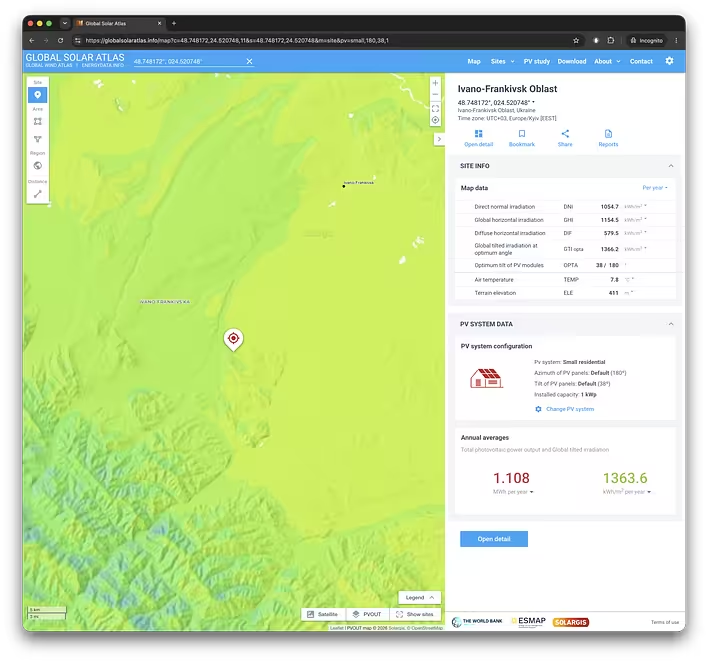
First, we open Global Solar Atlas and find on the map the location where the solar panels are installed.
In my case, it is the Ivano-Frankivsk region.
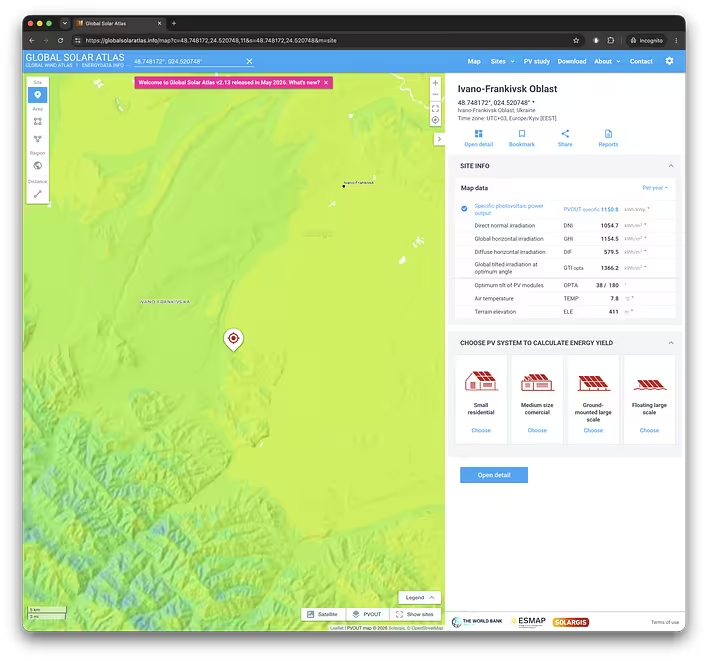
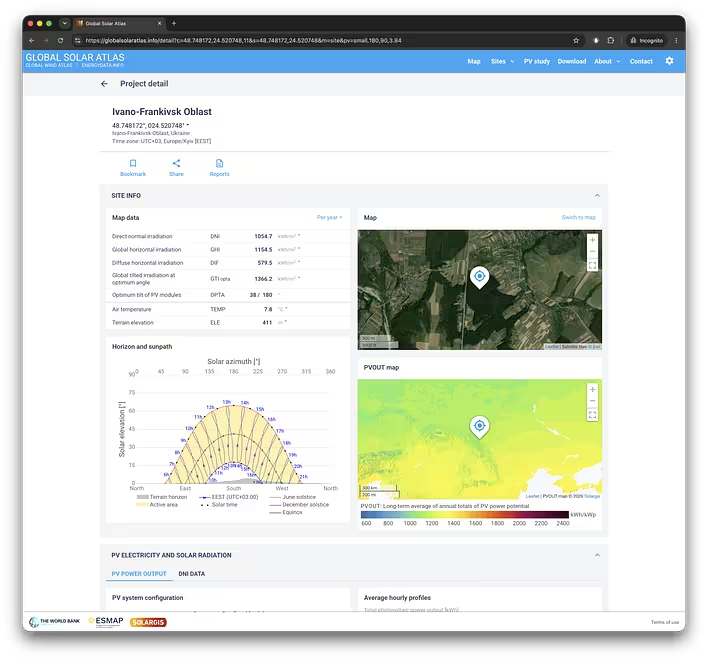
The service immediately shows basic information about the solar potential of this area.
For example, for my point, Global Solar Atlas shows:
GHI - 1154.5 kWh/m² per year - global horizontal solar radiation;
DNI - 1054.7 kWh/m² per year - direct normal radiation;
DIF - 579.5 kWh/m² per year - diffuse radiation;
GTI opta - 1366.2 kWh/m² per year - radiation on a surface with an optimal angle;
OPTA - 38° - optimal tilt angle of the panels.
The last two indicators are particularly interesting for comparison.
The service estimates that for this area, the optimal tilt of the panels is approximately 38°, while my panels are installed vertically - at 90°.
This means my installation is deliberately different from the optimal one.
And that is why simply taking the number from the map is not enough. It is necessary to set the actual parameters of your own solar station.
Setting Up Your Own System
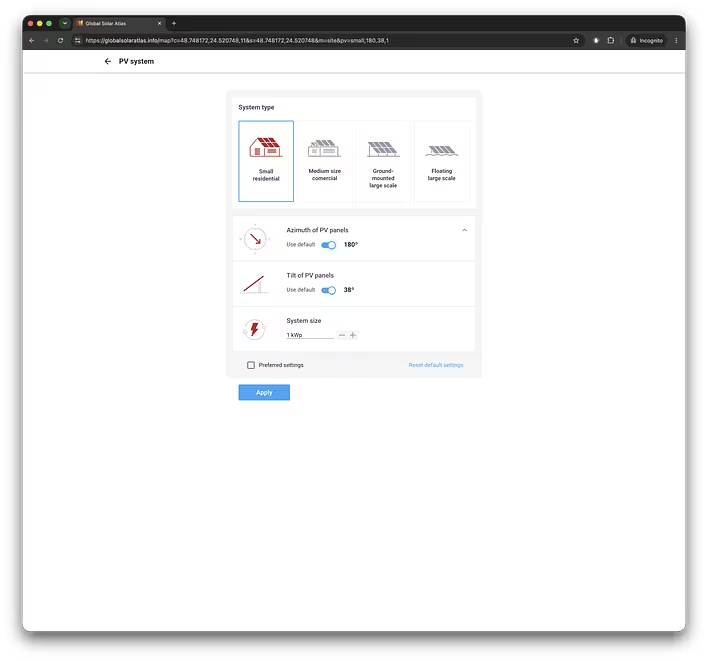
In the Choose PV system to calculate energy yield block, you can change the configuration of the PV system. First, we will select Small residential.
A standard solar station will be displayed:
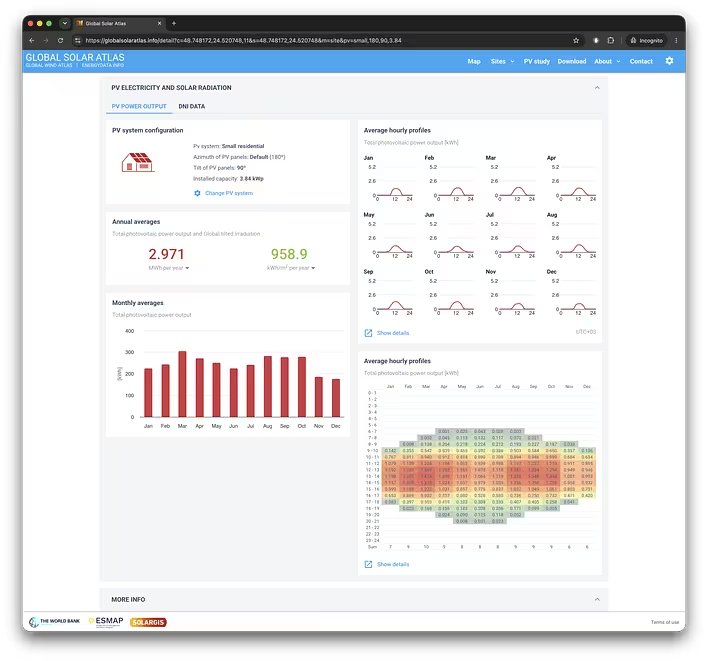
PV system configurationPv system: Small residentialAzimuth of PV panels: Default (180º)Tilt of PV panels: Default (38º)Installed capacity: 1 kWp
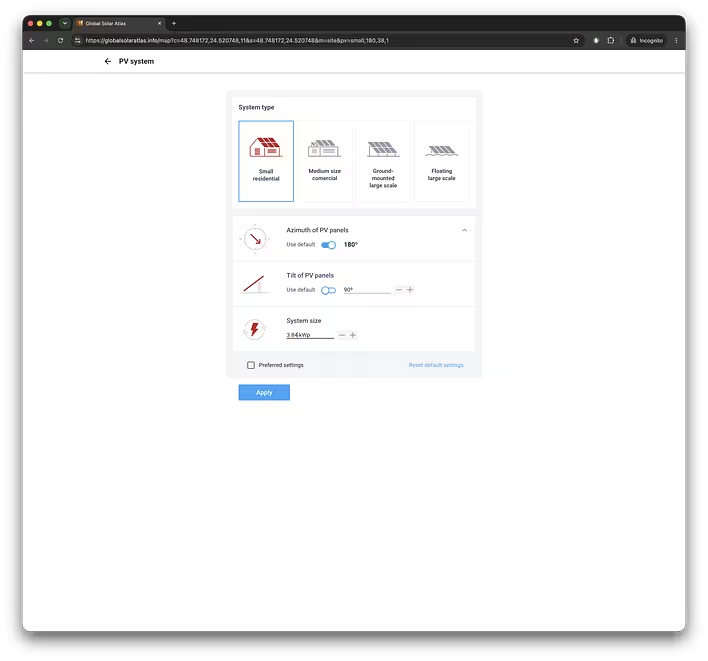
But we need to set our own parameters. Click Change PV System.
I set my parameters:
Parameter
Value
System type
Small residential
System size / Solar field capacity
3.84 kWp
Azimuth of PV panels / Azimuth
180°
Tilt of PV panels / Tilt angle
90°
What is kWp? kWp (kilowatt-peak) is the nominal or peak power of a solar power station.
Why 180°?
An azimuth of 180° means that the panels are directed to the south.
For my installation, this corresponds to the actual location of the panels.
Why 90°?
90° is a vertical installation.
This means the panels are actually mounted on a vertical wall of the house, not on a sloped roof.
It is important to specify this in the calculator because the tilt angle directly affects the amount of solar energy received by the panel surface throughout the year.
Click on Open detail:
What is the result
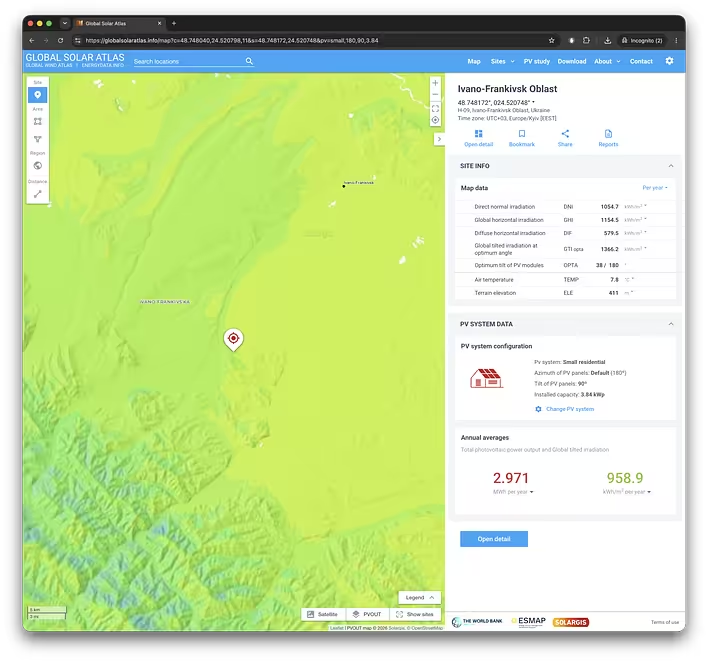
After entering these parameters, Global Solar Atlas calculates the expected generation.
For my system, it shows:
2.971 MWh per year
or approximately:
2971 kWh per year.
My station has a capacity of 3.84 kWp, so if we convert the result to specific output:
2971 ÷ 3.84 ≈ 774 kWh/kWp per year.
This is already a quite convenient figure for comparing different solar installations.
For example, it can be said that in my conditions, each installed kilowatt of solar panels, according to the Global Solar Atlas calculation, should produce approximately 774 kWh per year.
What do 2.971 MWh mean?
This does not mean that my station will produce the same amount of electricity every day.
On the contrary - generation throughout the year is very uneven.
And this is where it becomes interesting to look not only at the annual result but also at the monthly one.
кут 90 градусів
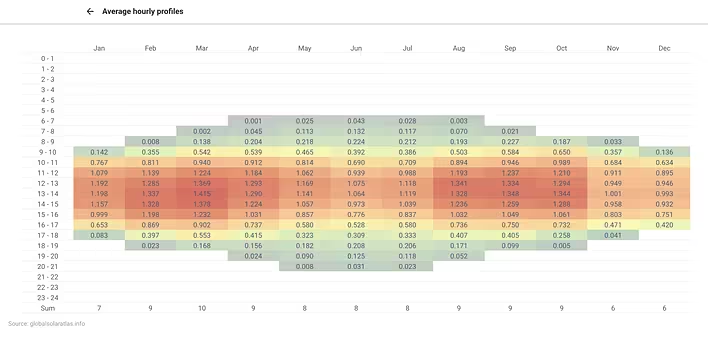
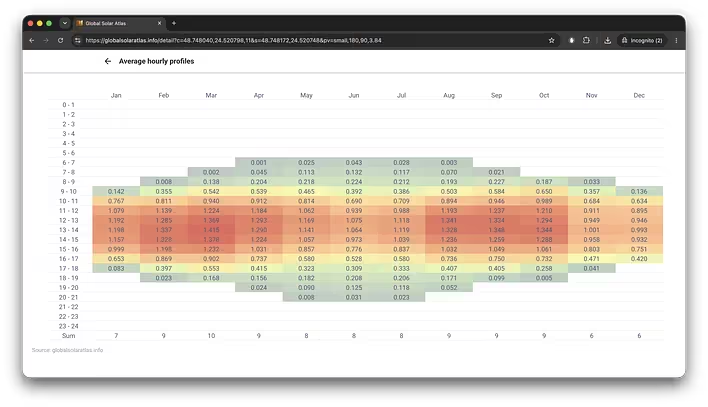
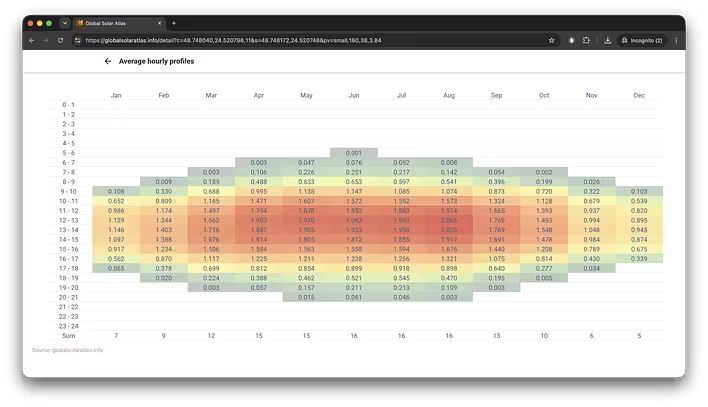
Here it is worth noting one point: the figures shown in the Average hourly profiles interface are not a ready table of monthly generation. This is an hourly profile that shows at what hours of the day and in which months generation is expected.
In other words, Global Solar Atlas allows you to look at the solar station not only from the perspective of "how many kilowatt-hours will there be in a year," but also to understand when exactly this energy appears.
Why I am interested in winter
My main reason for doing this calculation is not the annual generation.
In summer, 3.84 kW of panels already produce enough energy.
I am more interested in winter and possible blackouts.
There is a boiler, pumps, and basic electricity consumption in the house. Therefore, even relatively small generation on a sunny winter day can be useful.
And here, the vertical installation of the panels becomes an interesting compromise.
I consciously opted for a vertical installation of 90° instead of the optimal angle of 38°.
кут 90 градусів
The reasons are practical:
the panels are less covered by snow;
snow slides off a vertical surface more easily;
in winter, the sun is low on the horizon;
the panels take up less space;
there is no need to create a separate sloped structure on the wall.
But for this, one has to pay with lower annual generation.
Here is, for example, the Average hourly profiles graph for a 38-degree installation:
кут 38 градусів
Optimal angle vs. real
For my area, the service shows an optimal angle of about 38°.
This means that if I were designing the system solely to maximize solar generation, I would aim for approximately this angle.
But in real life, maximum annual generation is not always the only goal.
It is important for me to receive energy precisely when it is needed, as well as to have the simplest possible structure.
Therefore, 90° is not a "installation mistake," but a conscious compromise.
And now it can at least be approximately evaluated with numbers. Visually, it can be seen that the graph with 90 degrees in the cold months is more "active." But in terms of values, it is not significantly higher. So I took the values from both tables and fed them into AI for comparison. And the result is as follows:
Month
38°
90°
90° from 38°
November
≈150 kWh
≈123 kWh
82%
December
≈161 kWh
≈177 kWh
110%
January
≈208 kWh
≈227 kWh
109%
February
≈268 kWh
≈258 kWh
96%
November–February
≈787 kWh
≈785 kWh
≈100%
Over the year, vertical installation loses about 30% of generation compared to the optimal angle of 38°. But if you look at the cold months - November, December, January, and February - the difference practically disappears (in those months). And in December and January, vertical panels even provide about 10% more generation.
The ratio is percentage-based. But I also had AI calculate a 10 kW station. For some reason, November was calculated significantly better for the 10 kW station. Of course, the AI might have made some errors. So please verify all information independently.
Month
38°
90°
90° from 38°
November
≈480 kWh
≈480 kWh
100%
December
≈434 kWh
≈465 kWh
107%
January
≈527 kWh
≈589 kWh
112%
February
≈644 kWh
≈644 kWh
100%
November–February
≈2085 kWh
≈2178 kWh
104%
And the data is even a bit more interesting. Not exactly fire, of course. But the minimal need for snow cleaning is a big plus.
Of course, if selling electricity or using it actively - the angle of 38 degrees in my case is +30% of annual output.
Important nuance regarding the forecast
Global Solar Atlas explicitly warns that such estimates are primarily intended for preliminary analysis.
The service uses standard assumptions for many parameters of the PV system. For detailed design, tools are needed that take into account more parameters of the power plant itself and use more detailed meteorological data.
Therefore, the figure 2971 kWh per year should not be perceived as a guarantee.
This is a forecast.
And the most interesting thing for me is to compare this forecast with the actual generation of my 3.84 kW panels in a year.
Then it will be possible to check how close Global Solar Atlas turned out to be to reality specifically for vertical panels installed on a south wall.
And I will draw conclusions regarding/increasing the home solar power station.