This content has been automatically translated from Ukrainian.
I made a small automation: now every day at 11:00 PM n8n pulls data from my solar inverter (via solcloudy), sends it to ChatGPT, and publishes the finished report here in the blog.
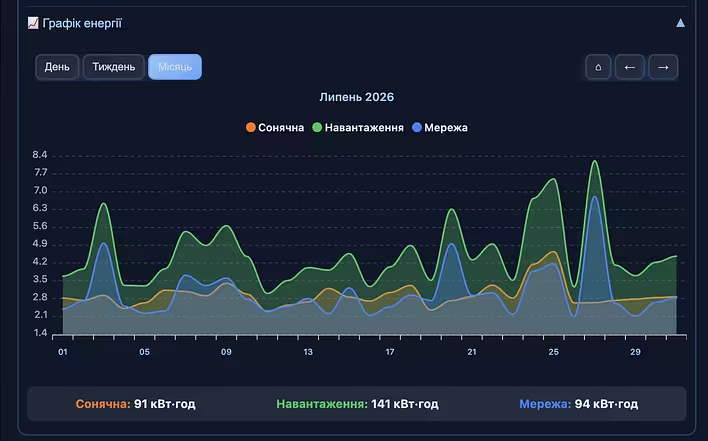
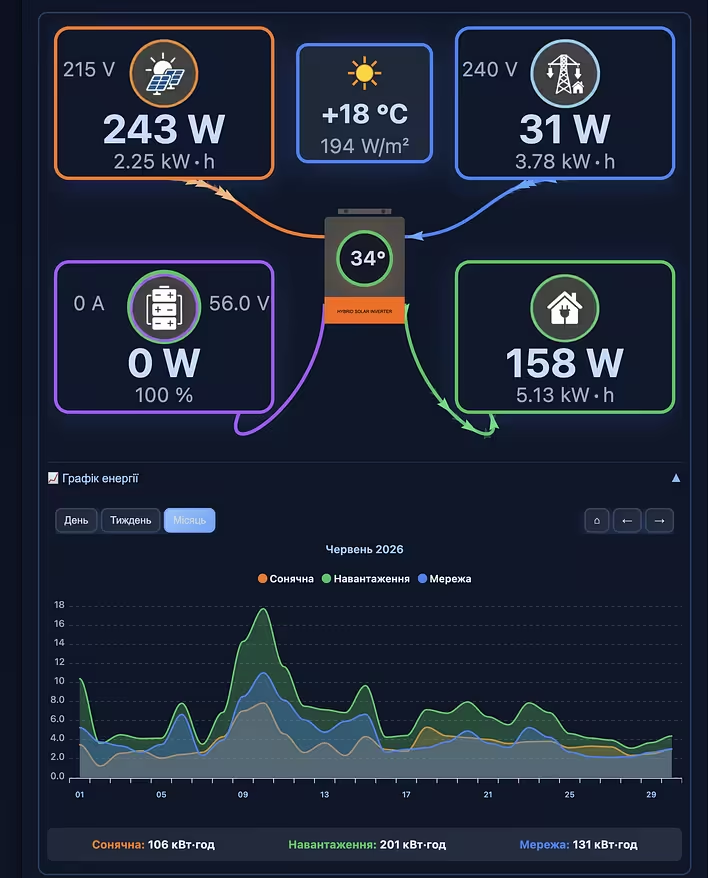
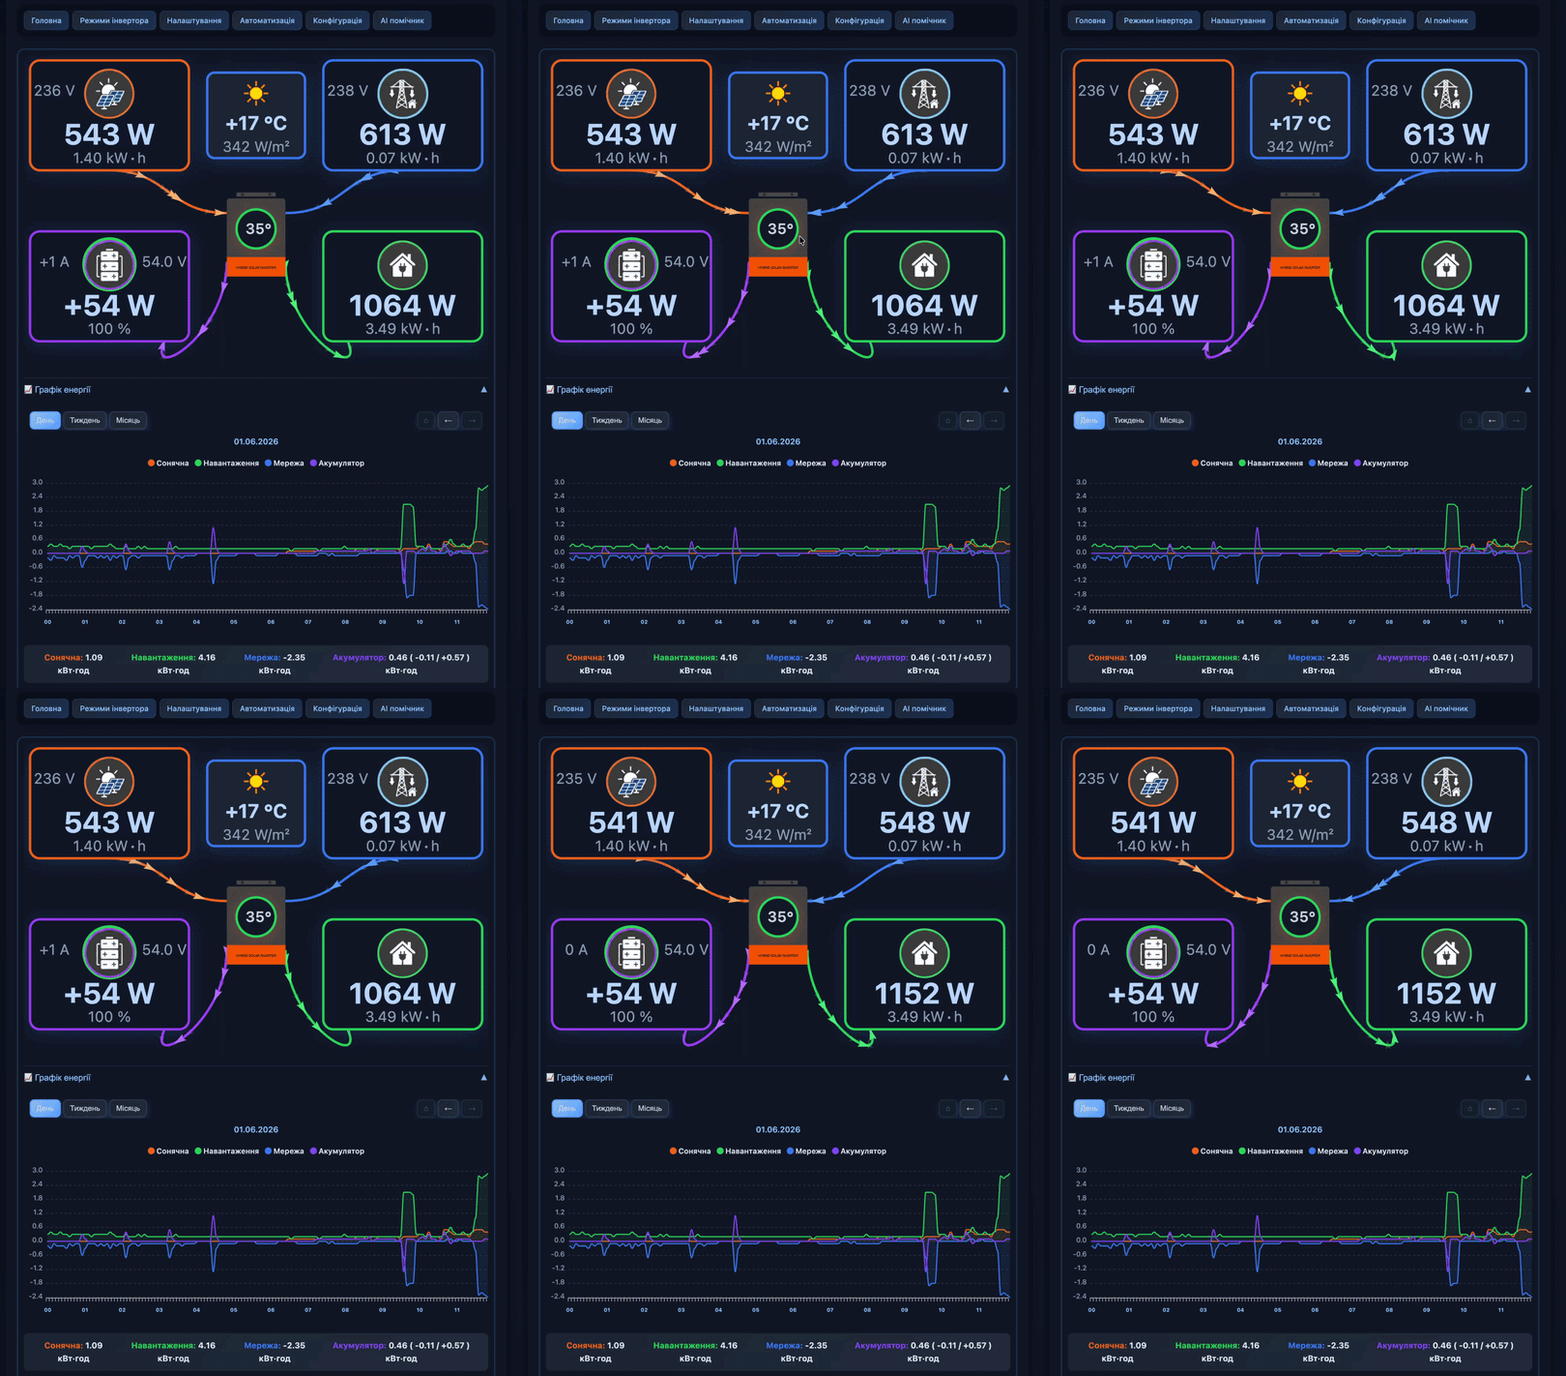
What will be in each post: how many kilowatt-hours the panels produced in a day, how much the house consumed, how much was taken from the grid, what the battery charge was, and what the weather was like. Plus, a forecast for the next day.
My setup
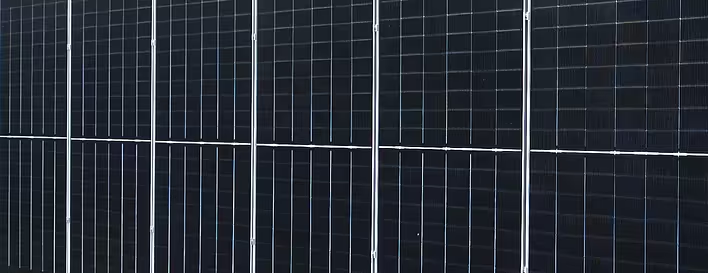
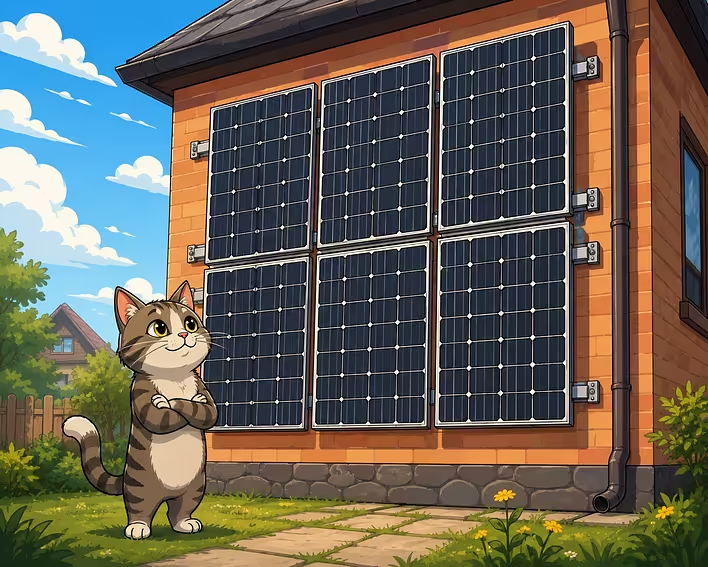
6 Longi TWMNH-66HD640 panels - N-type bifacial, double-glass, 640 W each, total peak power 3840 W. Mounted vertically on the south wall of the house - gray plaster. Ivano-Frankivsk region.
Vertical mounting is a conscious choice: there’s no other place to put them, and in winter there’s no need to clean snow. The angle is not ideal for maximum generation, but the system was not intended as the main source of energy. The main task is to have a backup in case of blackouts, so that we don’t remain without light and heat in winter.
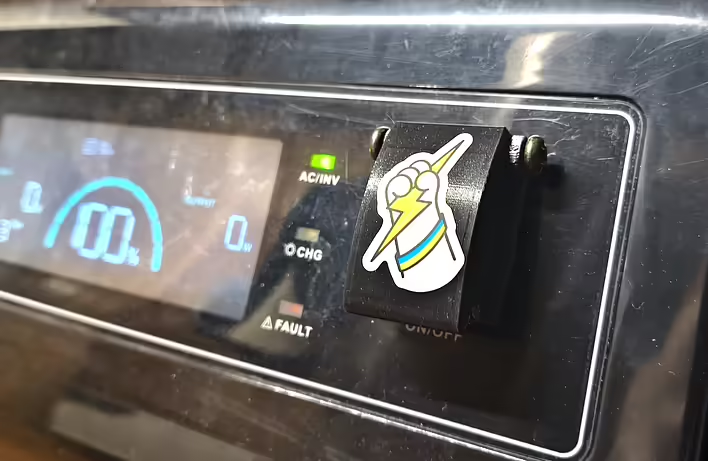
There is light from the city. The charging station KS 5200PS operates in SUB (Solar/Utility/Battery).
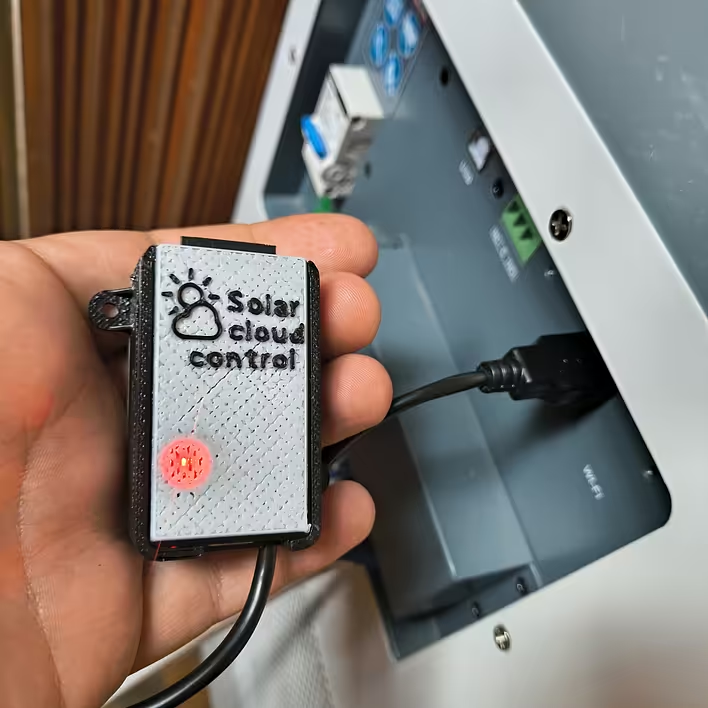
A battery and a hybrid inverter connected to the grid are connected to the panels. Monitoring is done by an ESP32 logger via SolCloudy.
If you’re interested in tracking real numbers - feel free to check it out.
Like it?React
🧵
This post doesn't have any additions from the author yet.

![[Personal experience] Replaced the speakers on macbook a2337 (speaker from Ali)](https://cdn.tseivo.com/uf686v8beaqlorcqcoybp2hxbgxp)